
By JP Leider, PhD, Center for Public Health Systems, University of Minnesota School of Public Health, for the Enumeration 2024 Project Team
There is an Open Secret among public health workforce researchers, policymakers, and practitioners. Most of the time, we don’t know how many people work in governmental public health. Which is silly. In any given quarter or year, the federal government knows, fairly precisely, how many folks are working in dentist offices around the country. Or doctor’s offices, as well as in all sorts of other fields and disciplines. They know both how many people are working in particular venues, and also what kinds of occupations these folks are working in. In public health, however, we are not fortunate enough to get either of those from the federal government. The Bureau of Labor Statistics, our main Federal statistical agency for employment data, has never counted governmental public health workers accurately and precisely (see articles led by Heather Krasna and Kristine Gebbie). Papers and books have been written about how this could possibly be – how a field as important as public health could, for decades, just not be counted – but it boils down to the fact that we are an interdisciplinary field, and our activities are delivered by health departments that are organized pretty differently across the states and localities. Because we’re not that large, numerically, it makes enumerations challenging and maybe not very important (in the eyes of the Feds) to count us accurately and precisely. It’s the same sort of reasoning as to why the Federal government also miscounts how much is spent on governmental public health. In short: it matters a lot to us to get the numbers right, but perhaps not as much to those who have to count every sector and industry. Where does this sad reality leave us?
Before, during, and after COVID-19 we did not have official estimates on how many people worked in governmental public health. What miscounts and lack of counts mean is that we have to count ourselves, which has been going on for decades. Every 10 to 15 years, some group comes together and enumerates the field, typically state and local, sometimes federal, and not yet Territorial and Tribal. The last enumeration was over a decade ago. These were simpler times: no COVID-19, just implementing the world-changing Affordable Care Act, dealing with the sequelae of the last (much smaller) pandemic, and we had Ebola and Zika on the horizon. Oh, and dealing with historic cuts associated with the Great Recession, where the workforce decreased 15%-20% overall, and didn’t recover before the COVID-19 pandemic.
Enter Enumeration 2024. It’s not very practical these days to go to each agency and ask people to put their hands up so that they can be counted. Hasn’t been for a while. Instead, these kinds of projects use what’s called a triangulation approach, where you don’t directly count but bring together multiple data sets and try to reconcile when there are differences and discordance. And discordance abounds. Whether because the years of collection are different, or different definitions are used, or people just answer the questions differently, one has to figure out how to sort these differences.
What we find particularly exciting about Enumeration 2024 is not just that we get to count the workforce (pretty exciting). It is that we’re doing so during a time when there’s actually investment in the workforce. That means knowing the size and composition of our workforce is more important than ever.
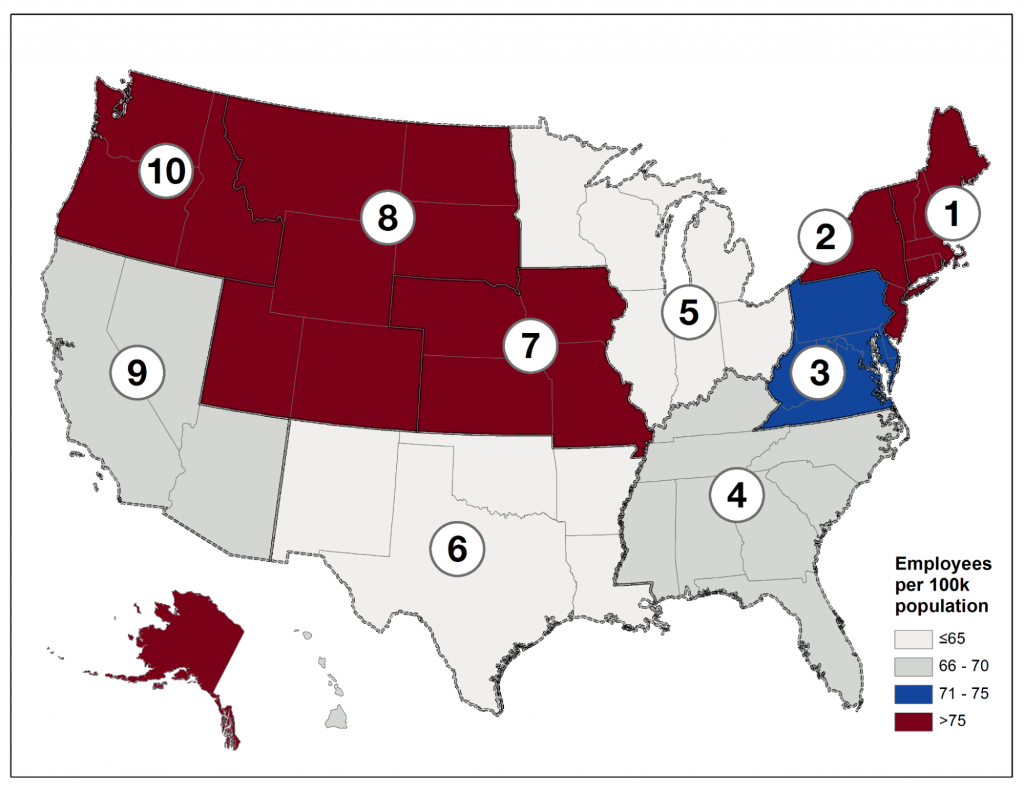
Note: Alaska is part of Region 10, and Hawaii is part of Region 9. Not pictured are Territories, Freely-Associated States, and Tribal Health Organizations.
Some highlights of the Enumeration 2024 report:
- In 2022, the governmental public health workforce at the state and local level employed approximately 239,000 staff (95% CI: (229,565, 252,498)), up from 206,500 in 2019.
- It is unclear if this COVID-19 associated growth will be maintained, as many of the positions added are temporary or term-limited.
- For local staff alone, the calculated estimates for employees and FTE in LHDs in 2022 were approximately 167,000 staff (95% confidence interval 159,431 – 181,053) and 151,000 FTE (95% confidence interval 144,868 – 160,279).
- An analysis of public health workforce per 100,000 population across the U.S., as visualized in Figure 1, highlights notable variation in worker distribution in absolute terms and on a per 100,000 population person basis.
- At the Federal level, approximately 14,000 staff (not including contractors) are employed by the Centers for Disease Control and Prevention (CDC) and the Health Resources and Services Administration (HRSA).
- There are many additional Federal agencies and subunits that perform public health functions or services to varying degrees, or who hold public health responsibilities.
- Depending on the extent that these entities are included in the Federal counts, there are between two and 74 Federal entities employing 14,000 and 237,000 staff.
- An analysis was conducted of occupations within governmental public health.
- Office and administrative support workers (approximately 37,500 staff), public health or community health nurses (~29,500), financial and operations business support workers (~21,500), and environmental health workers (~21,500) represent the largest occupation groups.
- Age profiles of individuals in public health varied by occupation group. The majority of the workforce is from ages 31 to 60.
- Some occupation groups skew younger, with nearly half of workers being 40 years or younger (i.e., disease intervention specialists, epidemiologists and statisticians, health educators, laboratory workers).
- Intent to leave was high in many occupation groups. Across nearly all occupation groups, more than 20% of individuals expressed interest in leaving their position within one year.
- Occupation groups with the greatest proportions of individuals with intentions to leave included: epidemiologists and statisticians (34.2%), emergency preparedness or emergency management workers (33.3%), and public information specialists (32.4%).
- Intentions to retire within five years ranged from 6.2% among epidemiologists and statisticians to 28.6% among agency leadership.
- An analysis was conducted from the data provided by the National Council of State Boards of Nursing.
- Public Health Nurses (PHNs) constituted about 2% (approximately 73,500) of registered nurses in the U.S.
- Ninety percent of these PHNs are working in what they indicate is either a public health or school health specialty, with a very small portion working in correctional health.
- Even when the governmental PHN definition was broadened to include additional specialties such as pediatrics and occupational health, the vast majority of these PHNs still indicated their specialties were in public health and school health, suggesting some consistency in how PHNs see themselves in their specialty roles and how they are utilized in practice.
To learn more, check out this resource: